



Blogs


Hidden Shelf Life: What Dr. Ismail Uysal Says Your Temperature Data Isn’t Telling You
Executive summary
Fresh produce can lose shelf life that no inspection detects. Dr. Ismail Uysal, an associate professor at the University of South Florida who has worked with DeltaTrak for more than a decade, calls this hidden shelf life loss. In earlier studies he cites, some products lost as many as 2 additional days of shelf life that growers, transporters and receivers had no idea about.
In an interview at the IFPA Global Produce & Floral Show 2026, Dr. Uysal explained five points:
- • Temperature data is the “what and when.” Shelf life is the “how and why.” A temperature log shows how a load was handled. It does not show the product’s current quality or the shelf life it has already lost.
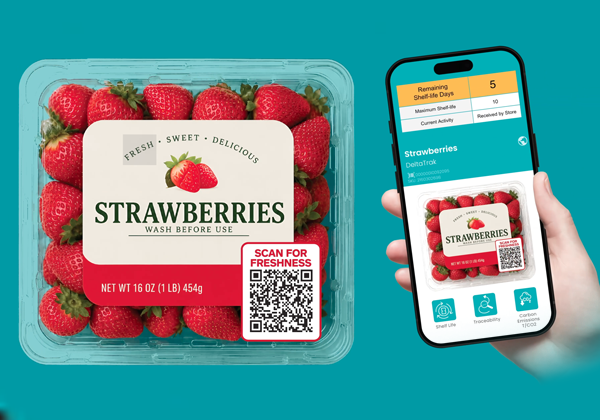
- • Hidden loss starts at harvest. For strawberries, the largest shelf life loss happens at the very beginning, when hot field temperatures meet a delay in pre-cooling.
- • Quality control cannot see it. A strawberry that has lost 1 to 2 days still looks bright, red and sweet at inspection. The loss shows up at the store or in the consumer’s fridge.
- • Shelf life data enables first-expired, first-out (FEFO) logistics. Retailers can reroute, shelve sooner or adjust pricing to protect the full-price selling window and reduce waste.
- • Prediction requires end-to-end data plus commodity expertise. Generative AI alone is not enough. Accurate models need harvest-to-store data and a model built for each commodity’s physical defects, such as mold on strawberries.
About the expert: Dr. Ismail Uysal
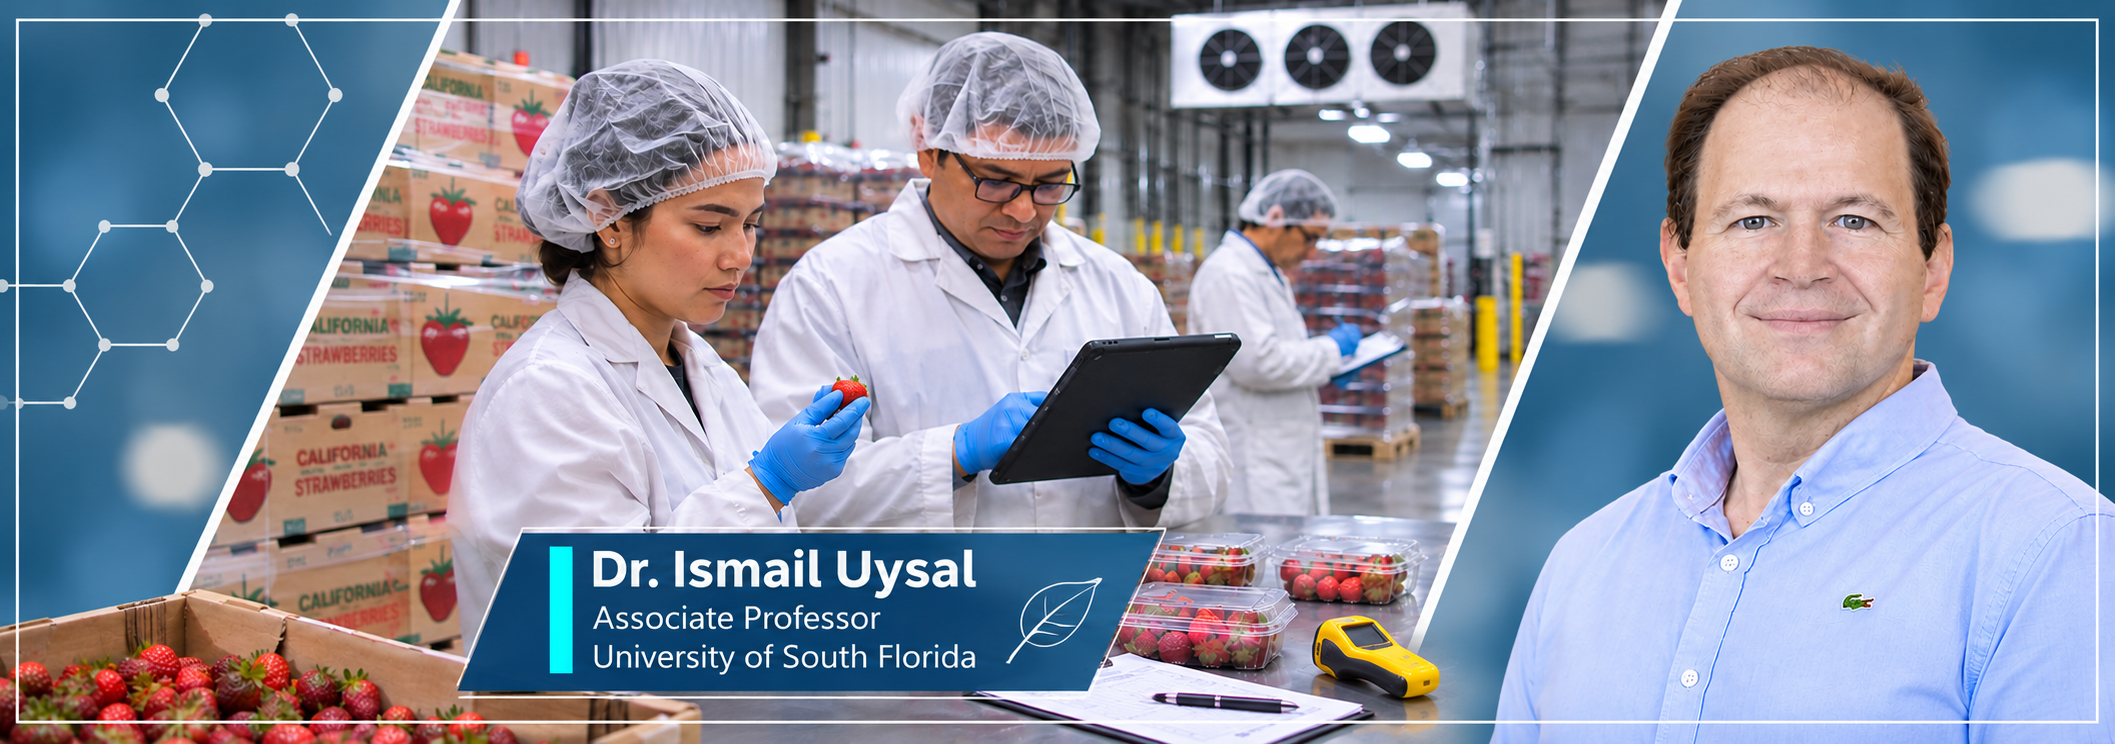
Dr. Ismail Uysal is an associate professor at the University of South Florida (USF). His research covers signal processing, machine learning and artificial intelligence (AI) and their applications in cold chain and healthcare.
His early work focused on wireless sensing, wireless sensors and data analytics. As sensors became ubiquitous and machine learning matured, he saw fresh produce and cold chain analytics as one of the best applications for those technologies.
“Fresh produce, trying to predict shelf life, and basically anything related to food analytics and cold chain analytics are probably among the best application areas for these technologies,” Dr. Uysal said.
He has worked with DeltaTrak for more than 10 years. That work spans temperature emulation, shelf life prediction, quality prediction and cold chain optimization. His recent work focuses on turning temperature data collected by sensors in the field into insight about product quality and using AI for predictive analytics throughout the entire cold chain.
Dr. Uysal was interviewed by Karl McDermott of DeltaTrak on Day 2 of the IFPA Global Produce & Floral Show 2026, at the DeltaTrak booth.
What is hidden shelf life?
Hidden shelf life loss is the excess shelf life a fresh product loses along the supply chain that standard quality control (QC) and quality assurance (QA) inspections cannot detect. The product still looks sound at receiving. The loss becomes visible later, at the store or in the consumer’s home.
“When the quality control people get this product, there is nothing that shows on it,” Dr. Uysal said. “It still looks good: bright, red, sweet. But it has already lost, say, one or two days of shelf life, which will only show when it gets to the store, or worse, to your fridge.”
How much shelf life is lost?
Hidden shelf life loss is measurable in hours and days. The amount depends on how well the cold chain is managed. Dr. Uysal said earlier studies showed that for some percentage of products, the hidden loss reached as many as 2 additional days.
Where does hidden shelf life loss occur?
Most stakeholders have some visibility into the middle of the supply chain. According to Dr. Uysal, most miss the two ends:
| Supply chain stage | What is often missed |
| Front end: harvest | |
| Middle: transport and distribution center (DC) | Where most stakeholders already have some visibility |
| Back end: after the DC | Conditions once product leaves the DC and arrives at the store |
Why the first hours after harvest matter most
For strawberries, the biggest shelf life loss occurs at the very beginning. When field temperatures are hot and pre-cooling is delayed, the product loses more shelf life than the length of the delay itself.
“If there is a delay in pre-cooling, then you’re going to be losing much more shelf life than the amount of time that was wasted,” Dr. Uysal said.
The result is a familiar consumer experience: strawberries bought bright and red at the store show mold within 2 days when brought home.
Why temperature data alone isn’t enough
Temperature monitoring is the foundation of cold chain management, but it answers a different question than shelf life does.
“I look at temperature data as the what and when, whereas shelf life and quality are the how and why,” Dr. Uysal said.
A temperature record tells a receiver how a shipment may have been managed. It does not reveal the product’s current quality or the hidden impact on its remaining shelf life.
From raw data to actionable data
Predictive shelf life models close that gap. They take time-temperature data and convert it into shelf life degradation information. That output supports decision points and boundaries along the cold chain.
| Conventional temperature log | Predictive shelf life | |
| Typical output | Time over threshold, excursion alerts | Shelf life lost, in hours and days |
| Question answered | What happened, and when? | How did it affect the product, and why? |
| Reveals current product quality | No | Yes, estimated from time-temperature history |
| Supports downstream decisions | Limited to accept or reject | Routing, shelving priority and pricing |
Time over threshold is the cumulative time a product spends above a set temperature limit. It flags that something happened. Predictive shelf life estimates what that exposure cost in sellable (marketable?) days.
Linking shelf life to physical defects, commodity by commodity
Every commodity shows temperature stress differently, so shelf life prediction must be commodity-specific. That was a major lesson from DeltaTrak’s customer meetings at the 2026 IFPA show.
Customers pointed to the defects they actually see and act on:
| Commodity | Physical defects cited |
| Strawberries | Mold growth, discoloration and mushy texture |
| Avocados | Browning |
| Grapes | Stem drying and dehydration |
QC personnel can observe each of these defects. The opportunity is to correlate time-temperature data with them, so lost shelf life is expressed as a specific defect and a specific timeline rather than an abstract number of days.
“If you see mold when you grab your strawberries from the fridge, that is one factor that immediately signals end of shelf life,” Dr. Uysal said. “If we can correlate our temperature data to those kinds of easily observable physical characteristics that growers themselves complain about, I think that would be a game changer.”
Commodity-specific models
Because each commodity behaves differently, each needs its own predictive model. A strawberry model, for example, would estimate the most likely timeline for mold to develop.
“Each commodity is going to have its own unique model that would predict some of those physical defects before they happen, or at least when they will happen,” Dr. Uysal said. These models can then be fine-tuned to each customer’s own cold chain.
First-expired, first-out: how retailers can act on shelf life data
First-expired, first-out (FEFO) is a logistics approach that moves product according to its remaining shelf life rather than its arrival date. Most transportation today runs on first-in, first-out (FIFO). Shelf life visibility makes FEFO possible.
“With this kind of insight into your cold chain, you can do first-expired, first-out logistics,” Dr. Uysal said.
Here is how a grocery chain could act when it knows a shipment has already lost 2 more days of shelf life than expected:
| Point of decision | Action |
| Distribution center | Route the product to a store closer to the DC |
| Store receiving | Put the product on the shelf sooner |
| Store merchandising | Apply a pricing adjustment or promotion |
The goal is to maximize the selling window at full price. That means fewer discounts and less product ending up as waste.
Where to start with predictive shelf life intelligence
The first step is a sensing infrastructure that collects end-to-end data. The second is an analytical layer that turns that data into decisions. Many companies have collected cold chain data for years. According to Dr. Uysal, the missing link has been what to do with it afterward.
“In this day and age of AI and machine learning, data is king,” he said. “But that’s only the first step.”
- 1. Collect end-to-end data. Monitor from the point of harvest all the way to the store. Data gaps at the front end or back end hide the loss you most need to see.
- 2. Add an analytical layer. Convert time-temperature data into shelf life and quality insight. Shelf life is only one output. The same layer can predict future outcomes and build a historical distribution of issues in a specific shipping lane to guide decisions.
- 3. Apply domain expertise and commodity-specific models. Match each commodity to the right model and focus on the physical defects that matter for it, then fine-tune to your own cold chain.
Why generative AI alone won’t predict shelf life
Generative AI cannot predict shelf life on its own. Prediction depends on a solid, complete data set from harvest to store, interpreted with domain expertise.
“You need end-to-end data,” Dr. Uysal said. “And then you need some domain expertise to make sure that data is used in an intelligent way.”
Key takeaways
- • Hidden shelf life loss can reach as many as 2 additional days for some products, and inspections at receiving do not catch it.
- • The largest loss for strawberries happens at harvest, when hot field temperatures combine with delayed pre-cooling.
- • Temperature logs show what happened and when. Predictive shelf life models show how it affected the product.
- • Commodity-specific models link temperature history to visible defects such as mold, browning and stem drying.
- • Shelf life data enables first-expired, first-out (FEFO) decisions that protect full-price sales and reduce waste.
- • Accurate prediction needs harvest-to-store data plus domain expertise. Generative AI alone is not enough.
Frequently asked questions
What is hidden shelf life loss?
Hidden shelf life loss is shelf life a fresh product loses in the supply chain that QC and QA inspections cannot detect. The product looks normal at receiving. The damage appears later as defects such as mold, at the store or in the consumer’s home.
How much shelf life can produce lose without anyone noticing?
Hidden loss is measured in hours and days. According to Dr. Ismail Uysal of the University of South Florida, earlier studies found that some products lost as many as 2 additional days of shelf life that growers, transporters and receivers were unaware of.
Where in the cold chain does most hidden shelf life loss occur?
For strawberries, the largest relative loss occurs at the very beginning, during harvest. Hot field temperatures combined with a delay in pre-cooling cause more shelf life loss than the delay itself. The back end, after product leaves the distribution center, is another common visibility gap.
Why isn’t a temperature data logger enough to know shelf life?
A temperature logger records what happened and when, such as time over threshold. It does not show the product’s current quality or how much shelf life was lost. Predictive models are needed to convert time-temperature data into shelf life degradation.
What is first-expired, first-out (FEFO)?
FEFO is a logistics method that prioritizes product by remaining shelf life instead of arrival order (first-in, first-out, or FIFO). Product with less shelf life left can be routed to a closer store, shelved sooner or promoted earlier.
Can generative AI predict produce shelf life?
Not on its own. Shelf life prediction requires a complete data set from harvest to store, plus domain expertise and models built for each commodity.
Why does each commodity need its own shelf life model?
Each commodity shows temperature stress differently. Strawberries develop mold and browning, avocados brown, and grapes show stem drying and dehydration. A commodity-specific model can predict when a particular defect is likely to appear.
See your hidden shelf life
Hidden shelf life loss is invisible at inspection, but it doesn’t have to stay invisible in your data. Learn how the latest generation of UBQ Services can help your organization improve visibility, reduce risk and optimize cold chain operations.

Karl McDermott
Currently the Chief SaaS Officer of DeltaTrak and the General Manager of the UBQ Network, a digital marketplace for Ag Food. Previously he held leadership positions at a Canadian SaaS freight tech provider, a SaaS truck load matching platform, and a last mile logistics firm. Karl was a recipient of Mexico’s innovation award 2018.